Geography/GIS

Recently, I’ve worked on spatial analysis projects to solve transportation, health, and sustainable development issues. In each project, I used my GIS skills to show meaningful spatial correlations, patterns, and trends in large datasets.
I’m experienced at using open-source spatial technologies to interpret and visualize insights in spatial data. In the past, I’ve used QGIS to create static maps from spatial data layers, PostGIS to store large spatial datasets, and R to perform powerful statistical analyses.
Along the way, I also learned high leverage database querying skills with SQL, and enterprise level data standardization & quality assurance techniques. These skills allow me to navigate complex GIS data collection, processing, and storage workflows.
Below is a brief introduction to the exciting personal and academic projects I’m working on.
City Scaling in France
My goal for this project was to model cities using a PostGIS database. Using a methodology developed by urban theorist Luís Bettencourt, I showed that all cities in France scale similarly to other cities around the world.
Specifically, I studied the evolution of multiple urban indicators as a function of city population to mathematically model scaling. These urban indicators proxied economic development, infrastructure efficiency, and wealth creation. GIS technologies proved indispensable in completing this project.
This project was very data-wrangling intensive due to its general nature. I had to compile spatial and non-spatial attribute data from multiple governmental sources and join and aggregate them together using ETL workflows and SQL queries to get “nice” datasets for each urban indicator. Only then could I visualize the data.
Using the tmap package in R, I created interactive choropleth maps, allowing users to visually compare the development of French cities. Below is an interactive map comparing the actual number of academics in each city with the anticipated number based on its population. Click for full interactivity!
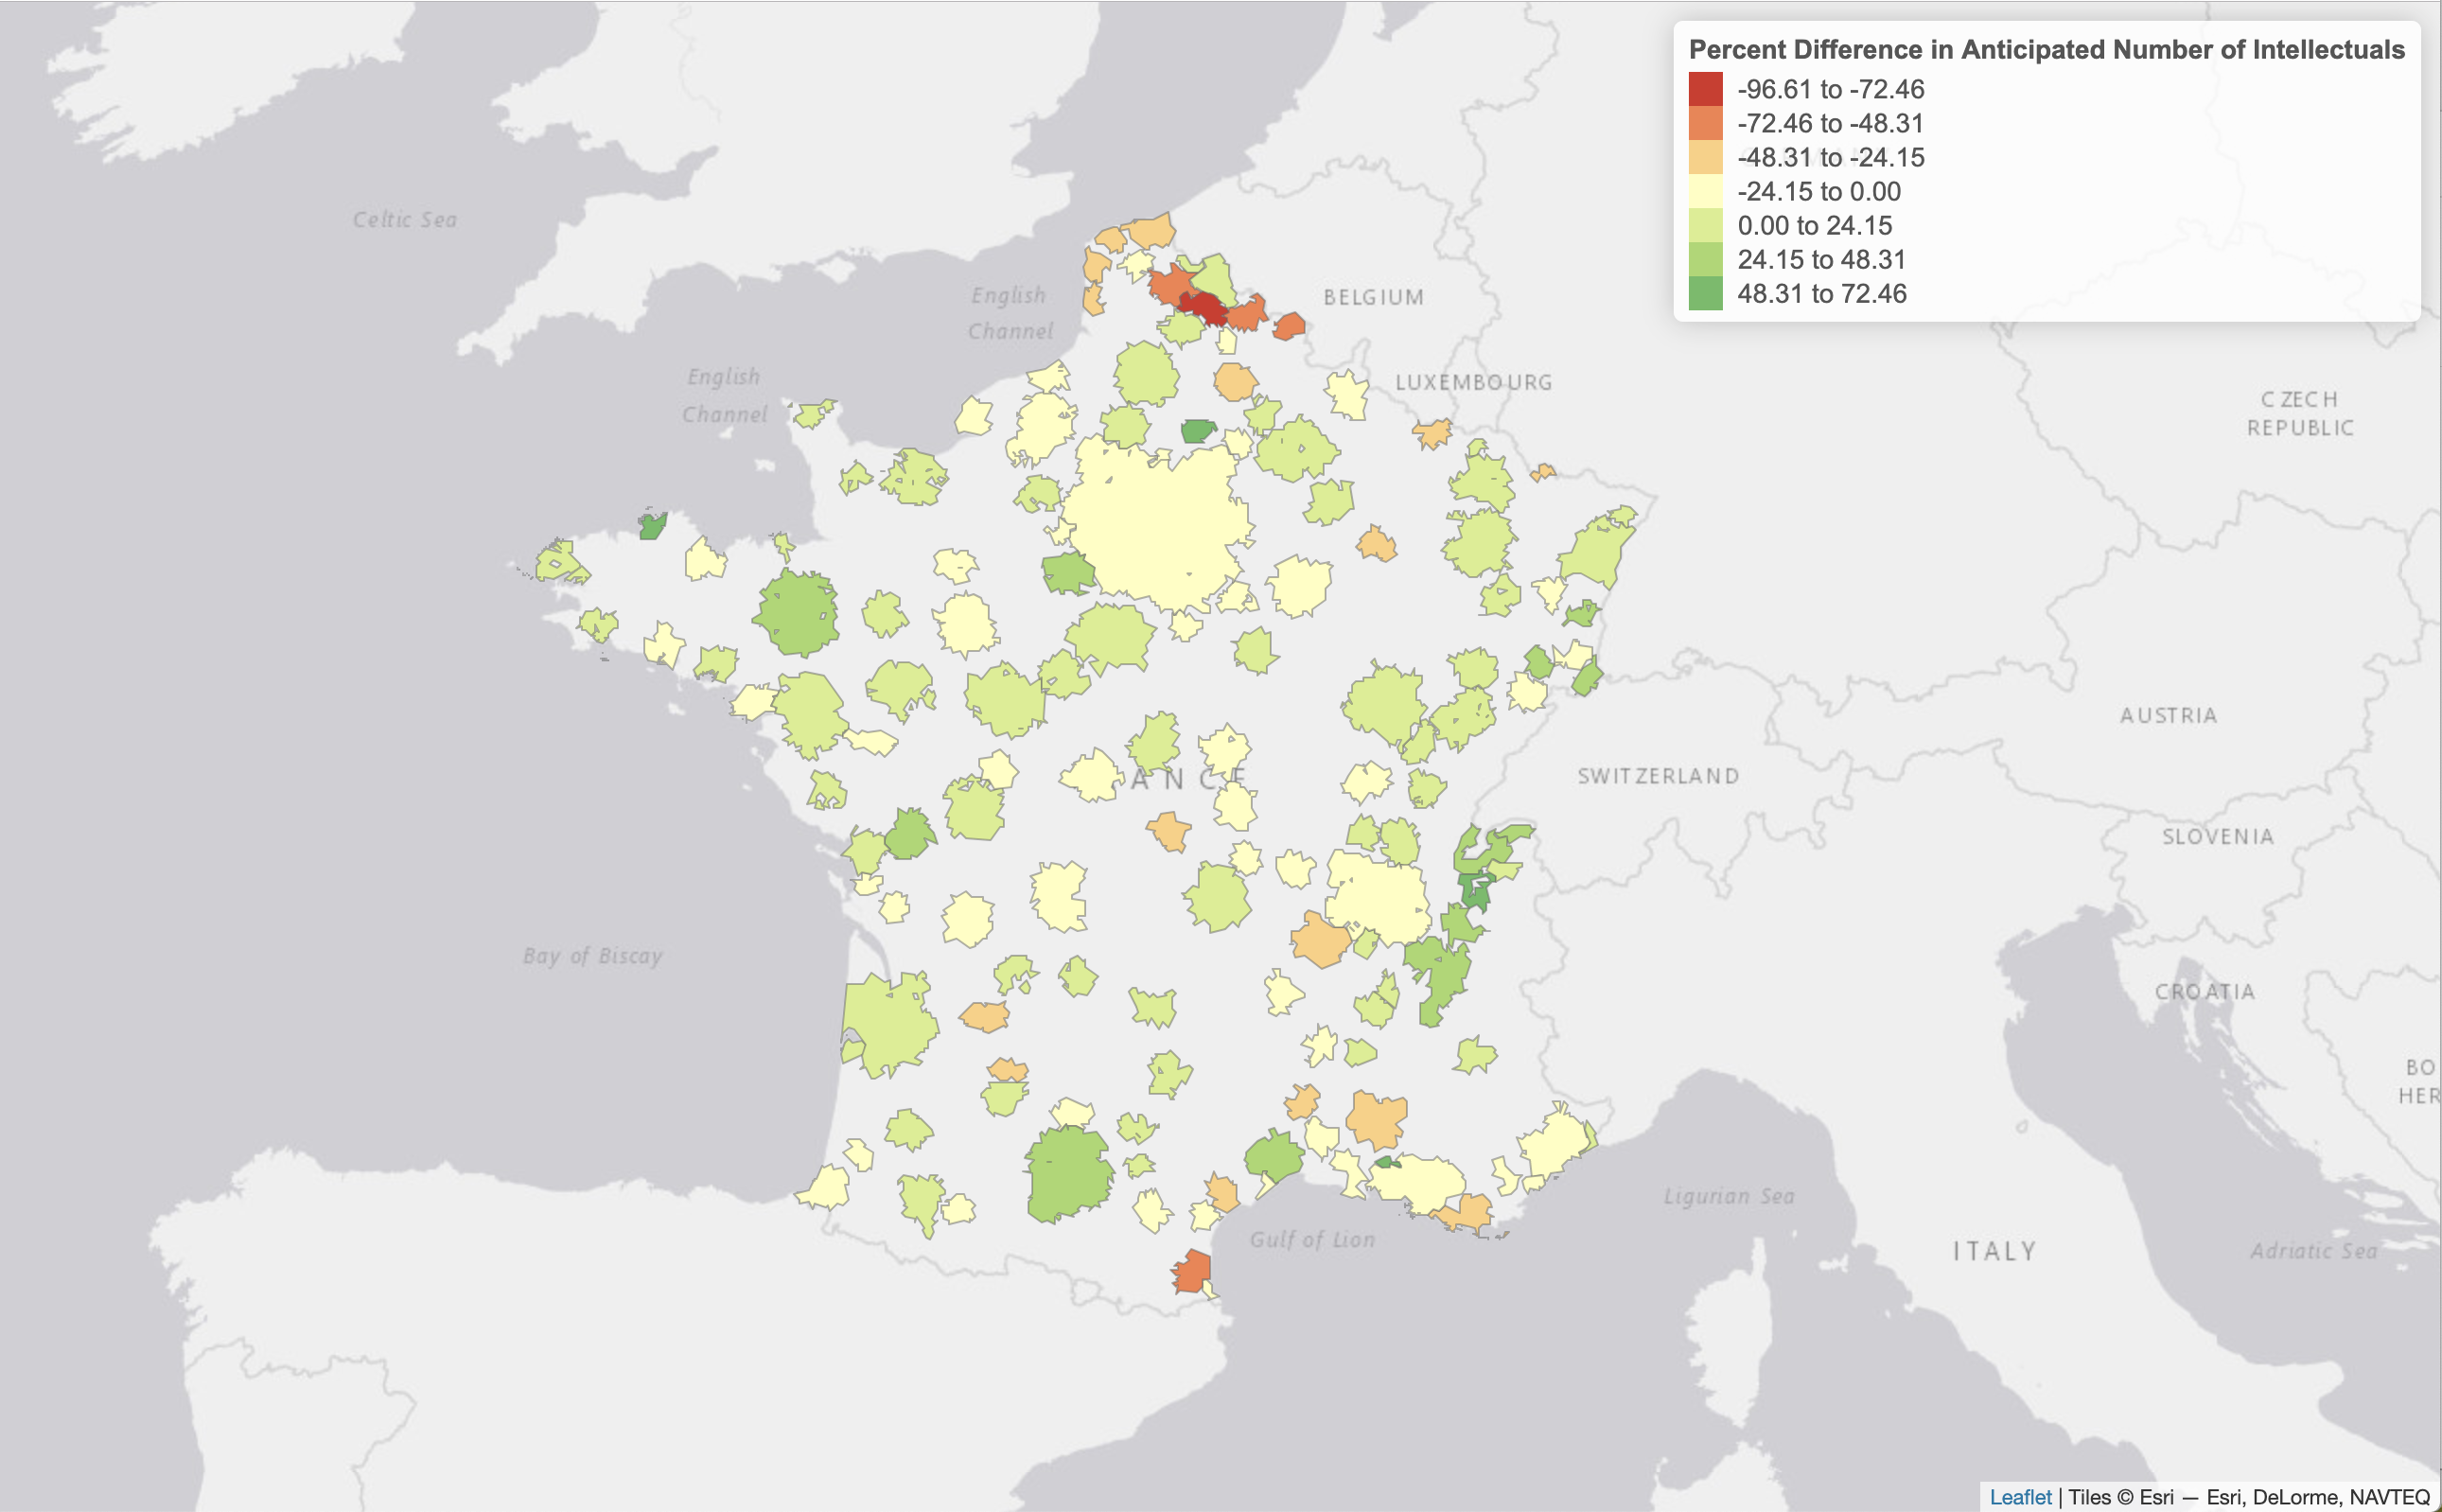
Learn more about the specifics of this project and its full findings here.
A New Valuation of Transit in Phoenix
This project blends my geographic and economic intuition together to create a new way to value public transit. I developed a GIS methodology to place a dollar value on accessibility for future Phoenix Valley Metro light rail line extensions.
First, I estimated the marginal cost of making light rail accessible to each resident by performing a buffer analysis in QGIS. My analysis estimated that it cost on average $6,820 (2018 dollars) to make light rail accessible to one resident along the light rail segments built since 2012. Then, I used this insight to predict a fair value for each of the proposed future light rail extensions.
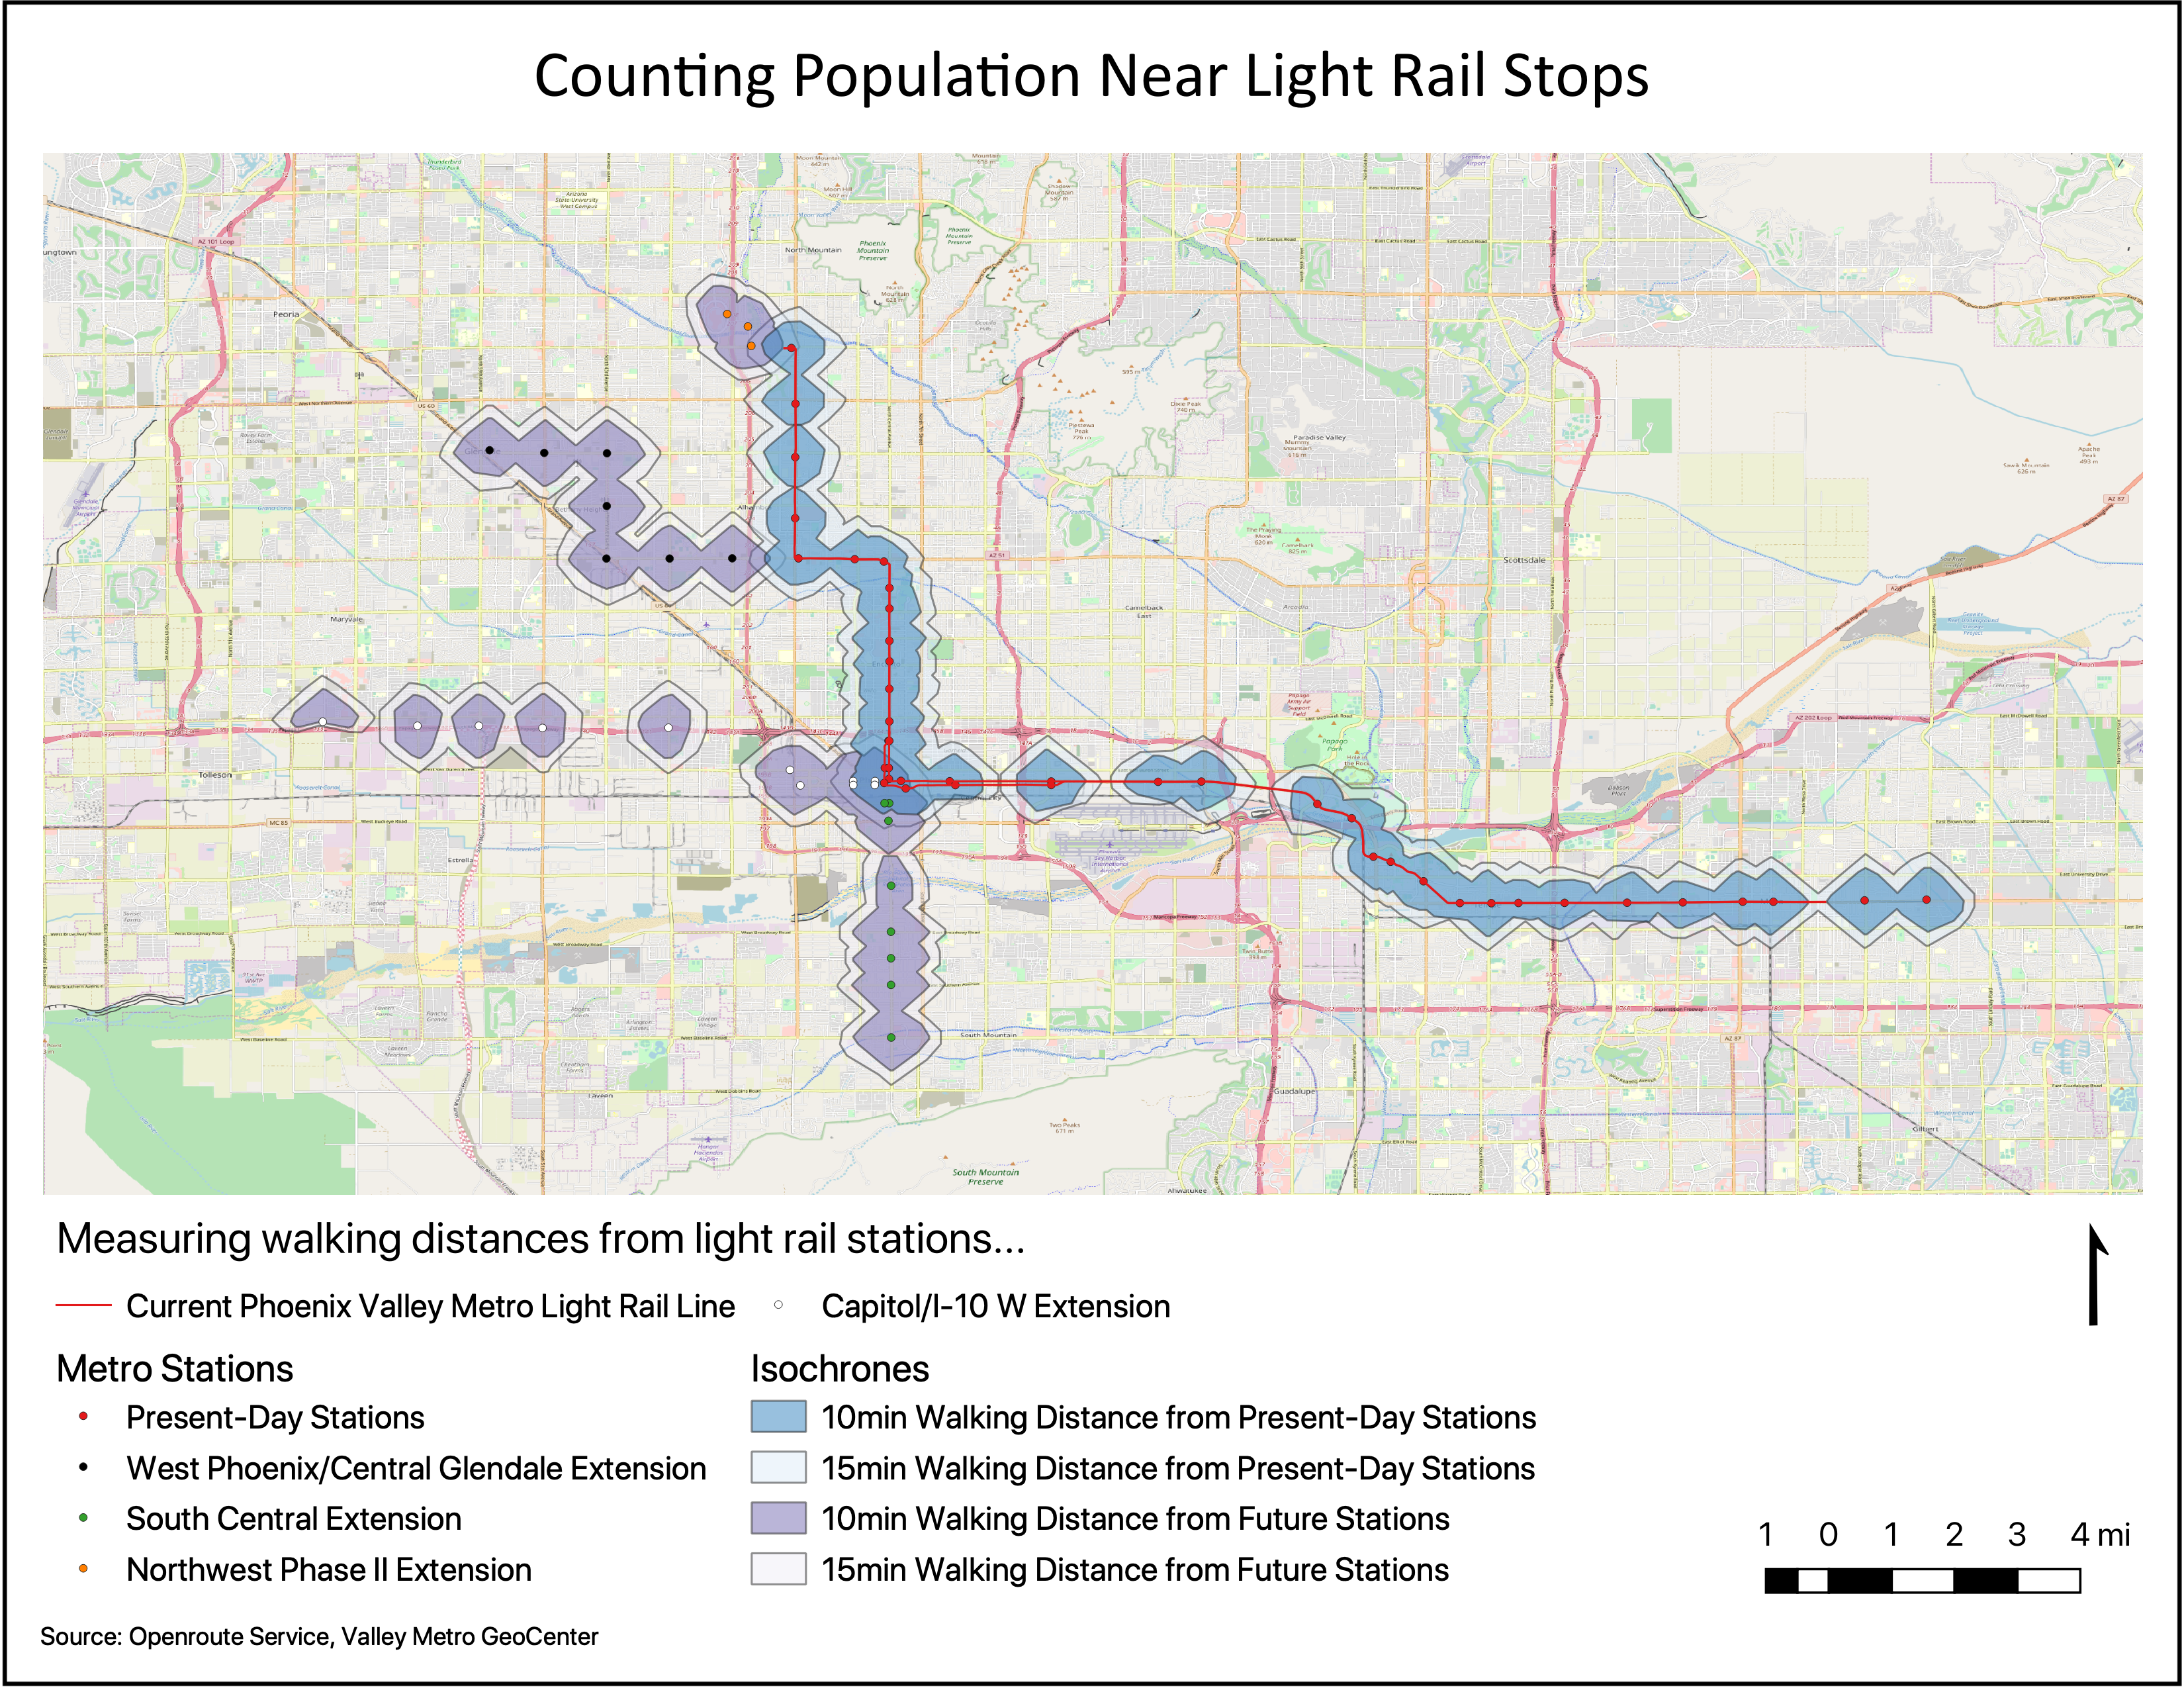
After calculating a fair value for each extension, I researched their actual estimated construction costs and compared the two values. What I found was that 2/4 extension projects were projected to cost a lot more than the accessibility value I calculated. But, the cost of the other 2 extension projects was in line with its accessibility value.
These results had some interesting ramifications, which can be found on this project’s detailed explanation here.
Future Projects
Down the line, I’m looking to work on some of these GIS-related projects.
- Malaria Data Vis: Continuing work from a hackathon with other UChicago students.
- Weather Servant: An application that serves weather updates to pilots for safer flights.
- X-Country Destination Finder: A simple project to help pilots easily find “Cross Country” airports within 50NM of their home airport.
- And More!